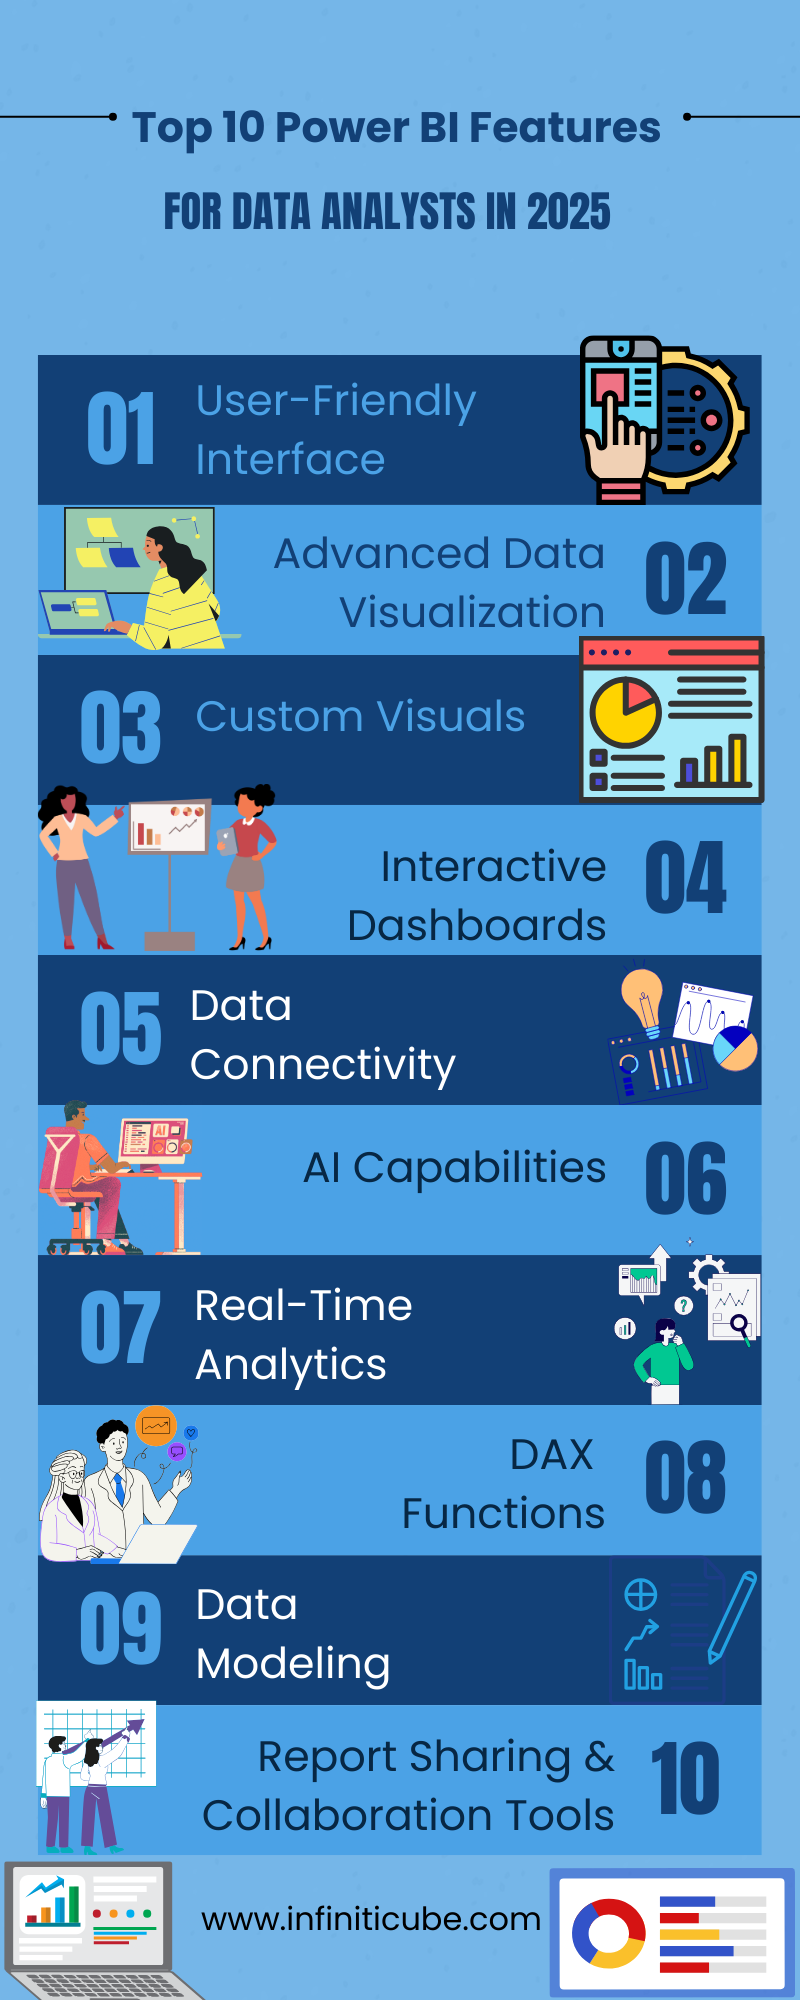
Power BI has evolved significantly, becoming essential for data analysts in 2025. Staying updated on its features is vital due to the increasing demand for data-driven decisions. Key features include interactive dashboards, advanced data modeling, and enhanced AI capabilities.
Recent updates, such as improved data connectivity and preparation tools, empower analysts. Notable advancements include a more user-friendly Row-Level Security Editor and DAX Query View update, enhancing data security and modeling efficiency.
Integrating Azure Machine Learning and Automated Machine Learning further enriches Power BI's capabilities. Future trends suggest ongoing innovation in the platform, solidifying its position in business intelligence.
1. User-Friendly Interface
Ease of Navigation and Usability
Intuitive Design Tailored for Data Analysts
Power BIis designed with data analysts in mind, ensuring that the interface is intuitive and user-friendly. The layout is clean and organized, making it easy to find and access various features and tools. Key aspects of the intuitive design include:
Ribbon Interface: Power BI uses a ribbon interface similar to other Microsoft products like Excel and Word. This familiarity reduces the learning curve, allowing new users to get up to speed quickly.
Customizable Dashboard: Users can customize their workspace, arranging tools and panels to suit their workflow preferences. This flexibility ensures that data analysts can optimize their workspace for efficiency.
Contextual Menus: Right-click menus and context-sensitive options provide quick access to relevant features, reducing the need to navigate through multiple menus.
Simplified User Experience
Power BI emphasizes a simplifieduser experience, enabling data analysts to focus on their analysis rather than struggling with the software. Several features contribute to this streamlined experience:
Drag-and-Drop Functionality:Creating visualizations and reports is made easy with drag-and-drop functionality. Users can quickly add data fields to their reports, rearrange visuals, and customize layouts without needing extensive technical knowledge.
Pre-Built Templates and Themes: Power BI offers a variety of pre-built templates and themes that help users create professional-looking reports and dashboards quickly. These templates provide a starting point, reducing the time and effort needed to design from scratch.
Guided Learning and Tooltips: Built-in tutorials, guided learning paths, and tooltips assist users in navigating the platform and utilizing its features effectively. These resources are particularly beneficial for new users, helping them to understand and leverage the software’s capabilities.
Search and Filter Options: The search bar allows users to quickly find specific features or commands, while filter options enable them to easily locate and work with relevant data. These tools enhance efficiency and streamline the user experience.
Consistent Updates and Improvements: Microsoft regularly updates Power BI, incorporating user feedback and improving the interface based on the latest usability trends. These updates ensure that the software remains user-friendly and meets the evolving needs of data analysts.
By focusing on an intuitive design and a simplified user experience, Power BI ensures that data analysts can efficiently navigate the software, create insightful reports, and derive meaningful insights from their data. This user-centric approach not only enhances productivity but also makes advanced data analysis accessible to a broader audience.
Power BI is continually evolving to offeradvanced data visualization capabilities that help data analysts present their findings in a clear, engaging, and impactful manner. Here are some of the key enhancements:
New and Improved Visualizations
Power BI regularly introduces new visualization types and enhances existing ones to meet the diverse needs of data analysts. Some of the notable improvements include:
Enhanced Charts and Graphs: New types of charts, such as bullet charts, funnel charts, and waterfall charts, provide more options for visualizing data trends and comparisons.
Custom Visuals Marketplace: The Power BI marketplace offers a growing library of custom visuals created by the community and third-party developers. These visuals extend the capabilities of Power BI, allowing users to find the perfect visual for their specific data needs.
Improved Interactivity: Visuals in Power BI are becoming increasingly interactive. Features like cross-filtering and cross-highlighting enable users to click on a data point in one visual to highlight related data in other visuals, making it easier to explore and understand complex datasets.
Advanced Formatting Options: Enhanced formatting options, such as conditional formatting, data bars, and color gradients, allow for more precise control over the appearance of visuals. This level of customization helps in highlighting key insights and making reports more visually appealing.
Real-Time Visuals: With the integration of real-time data streaming, Power BI can now display real-time data visualizations. This feature is crucial for scenarios where timely information is essential, such as monitoring live events or tracking real-time metrics.
Best Practices for Creating Impactful Visuals
Creating impactful visuals in Power BI requires following best practices that ensure clarity, accuracy, and effectiveness in data presentation. Here are some guidelines to achieve this:
Choose the Right Visual: Select the appropriate visual type for the data you are presenting. For instance, use line charts for trends over time, bar charts for comparisons, and pie charts for showing proportions. The right visual helps in conveying the message more effectively.
Simplify and Focus: Avoid clutter by focusing on key data points and removing unnecessary elements. Simplified visuals with a clear focus are easier to understand and more impactful.
Use Consistent Color Schemes: Consistent use of colors enhances readability and helps in distinguishing different data series. Use color gradients and conditional formatting to highlight important trends and outliers.
Leverage Interactive Features: Take advantage of Power BI’s interactive capabilities, such as drill-throughs, tooltips, and filters, to allow users to explore the data at different levels of detail. Interactive visuals engage users and provide deeper insights.
Maintain Data Integrity: Ensure that the visualizations accurately represent the underlying data. Avoid misleading representations by maintaining appropriate scales, using clear labels, and providing context for the data.
Tell a Story: Use visuals to tell a compelling data story. Arrange visuals in a logical sequence that guides the viewer through the data narrative. Annotations, titles, and descriptions can help in explaining the significance of the visuals.
Test with the Audience: Before finalizing the visuals, test them with a sample audience to gather feedback on their clarity and effectiveness. This feedback can help in refining the visuals to better meet the needs of the target audience.
By leveraging the advanced data visualization enhancements in Power BI and following best practices, data analysts can create impactful visuals that not only present data clearly but also engage the audience and drive informed decision-making.
Custom visuals in Power BI offer a high degree of personalization and customization, allowing data analysts to create unique and tailored visual representations that suit specific business needs. Here's how you can leverage custom visuals effectively:
Creating and Using Custom Visuals
Accessing Custom Visuals:
Power BI Marketplace: The Power BI marketplace provides a vast library of custom visuals developed by Microsoft and third-party developers. These visuals can be easily imported into your Power BI reports.
Custom Visuals Gallery: Explore the custom visuals gallery within Power BI to discover new and innovative visuals that can enhance your reports.
Importing Custom Visuals:
Navigate to the "Visualizations" pane in Power BI Desktop.
Click on the ellipsis (three dots) and select "Import from the marketplace" or "Import from file" to add custom visuals to your report.
Building Custom Visuals:
Power BI Developer Tools: Use Power BI Developer Tools to create your custom visuals. These tools include the Power BI Visuals SDK, which allows you to develop visuals using JavaScript or TypeScript.
Visualization Frameworks: Leverage popular visualization frameworks like D3.js to create sophisticated and interactive custom visuals that meet specific requirements.
Customizing Visuals:
Customize imported or created visuals to align with your brand and report aesthetics. Modify colors, fonts, sizes, and other visual elements to ensure consistency and clarity.
Use custom properties and parameters to provide additional control over the behavior and appearance of the visuals.
Advantages of Custom Visuals for Specific Business Needs
Tailored Visualizations:
Specific Business Requirements: Custom visuals allow you to address unique business requirements that standard visuals might not fully satisfy. For example, if your organization needs a specialized chart type or a unique way of displaying hierarchical data, custom visuals can provide the solution.
Industry-Specific Visuals: Different industries have unique data visualization needs. Custom visuals can cater to industry-specific requirements, such as specialized charts for financial services, healthcare, manufacturing, and more.
Enhanced Data Insights:
Complex Data Representation: Custom visuals can handle complex data representations that standard visuals might struggle with. For instance, visualizing intricate relationships, multi-dimensional data, or advanced statistical analyses becomes more feasible with custom visuals.
Interactive and Engaging: Custom visuals often offer enhanced interactivity and user engagement. Features like drill-downs, hover effects, and dynamic animations can make data exploration more intuitive and insightful.
Brand Consistency:
Corporate Branding: Ensure that your reports and dashboards align with your corporate branding guidelines. Custom visuals allow you to incorporate your organization's colors, logos, and design elements, creating a cohesive and professional look.
Personalization: Customize visuals to reflect the preferences and needs of your audience. Personalized visuals can make reports more relevant and engaging for different stakeholders.
Flexibility and Innovation:
Rapid Adaptation: As business needs evolve, custom visuals provide the flexibility to quickly adapt and create new visual representations. This agility ensures that your reports remain relevant and effective.
Innovation and Creativity: Encourage innovation by experimenting with new visual styles and techniques. Custom visuals enable you to push the boundaries of traditional data visualization and discover new ways to present and interpret data.
Integration with Advanced Analytics:
Advanced Analytical Techniques: Integrate advanced analytical techniques such as machine learning models, predictive analytics, and statistical methods into your custom visuals. This integration can provide deeper insights and more accurate forecasts.
Real-Time Data Integration: Custom visuals can be designed to handle real-time data feeds, making them ideal for scenarios where timely and up-to-date information is critical.
By leveraging the power of custom visuals in Power BI, data analysts can create personalized and customized visualizations that meet specific business needs, enhance data insights, and ensure brand consistency. This capability not only improves the overall effectiveness of data reporting but also drives better decision-making and business outcomes.
Interactive dashboards play a crucial role in data visualization and storytelling. By integrating various features such as filters, hover-over effects, and drill-down capabilities, interactive dashboards empower users to engage with the data in a dynamic and informative way. Whether it’s for internal reporting or client presentations, interactive dashboards provide an accessible and visually engaging platform for showcasing insights and conveying complex data clearly and compellingly.
Building Interactive Dashboards
Interactive dashboards in Power BI are powerful tools that allow data analysts to present complex data in a way that is engaging and easy to understand. Here’s how to build interactive dashboards and the features and benefits they offer:
Features that Enhance Interactivity
Slicers and Filters:
Slicers: Slicers are visual filters that allow users to segment and filter data by specific categories. They provide an intuitive way to explore different aspects of the data.
Cross-Filtering and Cross-Highlighting: Enable cross-filtering and cross-highlighting to allow users to click on a data point in one visual and see related data highlighted or filtered across other visuals on the dashboard.
Drill-Throughs:
Drill-Through Pages: Create drill-through pages to provide detailed views of data. Users can right-click on a data point and navigate to a more detailed report page focused on that specific data.
Drill-Down Hierarchies: Set up drill-down hierarchies in charts and tables, allowing users to click on higher-level data to reveal more detailed sub-levels.
Tooltips and Report Tooltips:
Dynamic Tooltips: Add dynamic tooltips that display additional data when users hover over data points. This provides context without cluttering the main visual.
Report Tooltips: Create report tooltips that show rich, detailed information from another report page when users hover over visuals.
Buttons and Bookmarks:
Navigation Buttons: Use buttons to create a more interactive navigation experience. Users can click buttons to switch between different report pages or views.
Bookmarks: Utilize bookmarks to save specific views of the dashboard. Combine bookmarks with buttons to create interactive storytelling elements, such as guided tours or scenario analysis.
Embedded Power Apps and Visuals:
Power Apps Integration: Embed Power Apps directly into Power BI dashboards to allow users to take action based on the data they see, such as submitting forms or updating records.
Custom Visuals: Incorporate custom visuals that offer enhanced interactivity and tailored user experiences.
Q&A Feature:
Natural Language Queries: Enable the Q&A feature to allow users to ask questions in natural language and receive answers in the form of visuals. This makes it easier for non-technical users to interact with the data.
Benefits of Data Storytelling and Presentations
Enhanced User Engagement:
Interactive Exploration: Interactive dashboards engage users by allowing them to explore data on their own. Users can interact with the visuals, apply filters, and drill down into details, making the experience more engaging and informative.
Personalized Insights: Users can tailor their view of the data to their specific interests and needs, which helps in uncovering personalized insights that are relevant to their role or decision-making process.
Improved Data Understanding:
Contextual Information: Interactive features like tooltips and drill-throughs provide contextual information without overwhelming the main visuals. This layered approach helps users understand the data more deeply.
Visual Storytelling: By guiding users through a narrative with bookmarks and interactive elements, data analysts can tell compelling stories with the data, making complex information more accessible and memorable.
Better Decision-Making:
Real-Time Interaction: Interactive dashboards allow users to interact with real-time data, enabling timely and informed decision-making. Users can see the impact of different scenarios and make data-driven decisions on the spot.
Scenario Analysis: With features like drill-downs and bookmarks, users can explore different scenarios and outcomes, helping them to anticipate potential challenges and opportunities.
Enhanced Collaboration:
Shared Insights: Interactive dashboards can be shared across teams and departments, facilitating collaboration. Users can interact with the same dashboard and share their insights and interpretations with others.
Actionable Insights: By embedding actionable elements like Power Apps, users can directly act on the insights they gain from the dashboard, streamlining workflows and improving efficiency.
Flexibility and Scalability:
Scalable Solutions: Interactive dashboards can scale with the organization’s needs. As new data becomes available, it can be integrated into the existing dashboards, ensuring they remain relevant and up-to-date.
Customizable Experience: The customizable nature of Power BI’s interactive features means that dashboards can be tailored to suit different audiences, from high-level executives to front-line staff.
By incorporating these interactive features and understanding their benefits, data analysts can create powerful, engaging, and insightful dashboards in Power BI. These dashboards not only enhance data storytelling and presentations but also drive better decision-making and foster a culture of data-driven insights within the organization.
Data connectivity is essential for seamless data integration. With the ability to connect to various data sources, users can benefit from real-time data updates and integration capabilities. This ensures that information is accurate and up-to-date, leading to better decision-making processes.
Power BI excels at connecting to a wide range of data sources and integrating them seamlessly into interactive reports and dashboards. Here’s how Power BI handles data connectivity and the advantages it offers for real-time data integration:
Connecting to Various Data Sources
Broad Range of Connectors:
Database Connections: Power BI supports connections to numerous databases, including SQL Server, MySQL, Oracle, PostgreSQL, and more. This flexibility allows data analysts to pull in data from different database systems easily.
Cloud Services: Power BI can connect to various cloud services such as Azure, Amazon Redshift, Google BigQuery, and Snowflake. This enables organizations to leverage cloud-based data storage and computing power.
File-Based Data: Data analysts can import data from various file formats like Excel, CSV, XML, JSON, and PDF. This is particularly useful for integrating data from different sources or legacy systems.
APIs and Web Services: Power BI supports connections to web services and REST APIs, allowing for integration with a wide range of online services and custom applications.
SaaS Applications: Direct connectors to popular SaaS applications like Salesforce, Dynamics 365, Google Analytics, and more make it easy to integrate data from these platforms into Power BI.
Data Preparation and Transformation:
Power Query Editor: Power BI’s Power Query Editor allows users to clean, transform, and shape data before loading it into the report. This tool supports a wide range of transformations, including filtering rows, merging tables, pivoting data, and more.
ETL Capabilities: The Extract, Transform, Load (ETL) capabilities in Power BI enable data analysts to handle complex data integration tasks, ensuring that the data is ready for analysis.
Real-Time Data Updates and Integration Capabilities
Streaming Data and Real-Time Dashboards:
Streaming Data Sources: Power BI can connect to streaming data sources to display real-time data. This is essential for use cases that require up-to-the-minute information, such as monitoring social media feeds, IoT sensor data, or live financial data.
Real-Time Dashboards: Real-time dashboards in Power BI can be set up to automatically update as new data arrives, providing users with current information without the need for manual refreshes.
DirectQuery and Live Connections:
DirectQuery Mode: In DirectQuery mode, Power BI queries data directly from the source in real time rather than importing it. This approach is beneficial for handling large datasets or when up-to-date data is crucial.
Live Connection to Analysis Services: Power BI supports live connections to SQL Server Analysis Services (SSAS) and Azure Analysis Services. These live connections ensure that users are always working with the most current data available.
Scheduled Refreshes:
Automatic Data Refresh: Power BI allows users to schedule automatic data refreshes at regular intervals. This ensures that the data in reports and dashboards is always up to date without manual intervention.
Incremental Refresh: For large datasets, incremental refreshes can be set up to only update the data that has changed since the last refresh. This reduces load times and improves performance.
Data Gateway:
On-Premises Data Gateway: The On-Premises Data Gateway allows Power BI to connect to on-premises data sources securely. This ensures that organizations can integrate their internal data sources with Power BI while maintaining data security and compliance.
Enterprise Gateway: For larger organizations, the Enterprise Gateway supports connecting multiple on-premises data sources to Power BI, providing a scalable solution for seamless data integration.
By leveraging these data connectivity features, Power BI enables seamless integration of various data sources, supports real-time data updates, and provides robust tools for data preparation and transformation. These capabilities ensure that data analysts can work with comprehensive, up-to-date data, leading to more accurate analyses and informed decision-making.
6. AI Capabilities
One of the key features of artificial intelligence is its ability to provide insights and analytics. Utilizing AI-driven insights and analytics can significantly improve data analysis and decision-making. By incorporating artificial intelligence into your processes, you can enhance the accuracy and speed of these tasks, ultimately leading to more informed and data-driven decisions.
Incorporating Artificial Intelligence
Power BI's AI capabilities significantly enhance data analysis and decision-making processes. By incorporating advanced AI features, data analysts can uncover deeper insights, predict trends, and make more informed decisions. Here’s how AI-driven insights and analytics work in Power BI and their impact on data analysis:
AI-Driven Insights and Analytics
Cognitive Services Integration:
Text Analytics: Power BI can integrate with Azure Cognitive Services to analyze text data. This includes sentiment analysis, key phrase extraction, and language detection, helping analysts understand customer feedback, social media sentiment, and other text-based data sources.
Image Recognition: Image recognition capabilities allow Power BI to analyze and tag images, making it possible to integrate visual data into reports and gain insights from image content.
Natural Language Processing (NLP):
Q&A Feature: The Q&A feature in Power BI allows users to ask questions in natural language and receive answers in the form of visuals. This makes data exploration more accessible to non-technical users and enables quick insights.
Smart Narratives: Smart narratives automatically generate textual summaries of key insights from visuals. This helps users quickly understand the main points of a report without delving into the data.
Automated Machine Learning (AutoML):
Predictive Analytics: Power BI integrates with Azure Machine Learning to build and deploy machine learning models. AutoML simplifies this process by automating the selection of algorithms and hyperparameters, enabling predictive analytics without requiring deep data science expertise.
Forecasting: Built-in forecasting tools allow users to add predictive models to their visuals, helping to forecast future trends based on historical data.
Anomaly Detection:
Outlier Detection: AI-driven anomaly detection identifies unusual patterns and outliers in the data. This is useful for monitoring business metrics, detecting fraud, and identifying operational issues.
Automated Insights: Power BI can automatically detect and highlight significant changes in data, providing users with insights into what’s driving these changes.
How AI Enhances Data Analysis and Decision-Making
Deeper Insights:
Uncover Hidden Patterns: AI capabilities in Power BI help uncover hidden patterns and relationships in data that might not be visible through traditional analysis methods. This enables a deeper understanding of complex datasets.
Enhanced Data Exploration: Features like Q&A and smart narratives make data exploration more intuitive, allowing users to quickly find answers and insights without needing advanced analytical skills.
Improved Accuracy:
Data-Driven Predictions: AI-driven predictive models enhance the accuracy of forecasts and predictions. This helps businesses anticipate future trends and make proactive decisions.
Reduction of Human Error: Automated AI analyses reduce the likelihood of human error in data interpretation, leading to more reliable insights.
Efficiency and Speed:
Automated Analysis: AI capabilities automate many aspects of data analysis, saving time and effort for data analysts. This allows analysts to focus on strategic decision-making rather than manual data processing.
Real-Time Insights: AI can process and analyze data in real-time, providing immediate insights that are crucial for time-sensitive decisions.
Enhanced Decision-Making:
Data-Driven Decision-Making: By providing accurate and timely insights, AI helps businesses make decisions based on data rather than intuition. This leads to more effective and strategic outcomes.
Scenario Analysis: Predictive analytics and forecasting enable scenario analysis, allowing businesses to evaluate different strategies and their potential impacts before implementation.
Scalability:
Handling Large Datasets: AI-powered tools in Power BI can handle and analyze large volumes of data efficiently, making it possible to scale analytics as data grows.
Adaptability: AI models can be continuously trained and updated with new data, ensuring that the insights and predictions remain relevant and accurate over time.
By incorporating AI-driven insights and analytics, Power BI empowers data analysts to perform more sophisticated analyses, uncover deeper insights, and make better-informed decisions. These AI capabilities transform raw data into actionable intelligence, driving business success in an increasingly data-driven world.
7. Real-Time Analytics
Real-time analytics is a critical component in today’s data-driven business landscape. Real-time data processing and analysis provide valuable insights into customer behavior, operational efficiency, and market trends. Businesses rely on the ability to access and interpret real-time data to stay competitive and responsive. Features such as low-latency data ingestion, stream processing, and real-time visualization support optimal real-time analytics, guiding important decisions for companies across various industries.
Real-Time Data Processing and Analysis
Real-time analytics in Power BI enables businesses to process and analyze data as it is generated, providing immediate insights that are crucial for timely decision-making. Here’s an overview of the importance of real-time analytics for businesses and the features in Power BI that support real-time data processing:
Importance of Real-Time Analytics for Businesses
Timely Decision-Making:
Immediate Insights: Real-time analytics provides businesses with up-to-the-minute data, allowing decision-makers to respond quickly to changes and emerging trends. This immediacy is critical in fast-paced environments where delays can lead to missed opportunities or increased risks.
Operational Efficiency: Businesses can monitor and optimize their operations in real-time, ensuring that processes run smoothly and efficiently. This is especially important in industries like manufacturing, logistics, and retail, where real-time data can help in avoiding bottlenecks and improving service delivery.
Enhanced Customer Experience:
Proactive Customer Service: Real-time data enables businesses to offer proactive customer service by quickly identifying and addressing issues as they arise. This leads to higher customer satisfaction and loyalty.
Personalized Experiences: With real-time insights, businesses can tailor their offerings and interactions to individual customer preferences and behaviors, enhancing the overall customer experience.
Competitive Advantage:
Market Responsiveness: Real-time analytics allows businesses to stay ahead of the competition by responding swiftly to market changes, such as shifting consumer demands or new competitor actions.
Innovation and Agility: Businesses can experiment and innovate more effectively with real-time feedback, adjusting strategies and tactics based on immediate data.
Risk Management:
Fraud Detection: Real-time data processing helps in identifying fraudulent activities as they occur, enabling businesses to take immediate corrective actions and minimize potential losses.
Operational Risks: By continuously monitoring operations, businesses can quickly detect and mitigate risks, such as equipment failures or supply chain disruptions.
Features that Support Real-Time Data Processing
Streaming Data Sets:
Real-Time Dashboards: Power BI supports streaming data sets, allowing dashboards to be updated in real time as new data arrives. This is particularly useful for monitoring live events, tracking real-time metrics, or displaying data from IoT devices.
Push Data Sets: Data can be pushed into Power BI using REST APIs, ensuring that the latest data is always available for analysis. This method supports various real-time data sources, including telemetry data, application logs, and financial transactions.
DirectQuery and Live Connections:
DirectQuery Mode: In DirectQuery mode, Power BI retrieves data directly from the source in real-time, rather than storing it in Power BI. This ensures that users are always working with the most current data available.
Live Data Connections: Power BI supports live connections to data sources like SQL Server Analysis Services (SSAS) and Azure Analysis Services. These live connections allow for real-time querying and analysis, ensuring that reports and dashboards reflect the latest data.
Data Refresh:
Automatic Data Refresh: Power BI allows users to set up automatic data refresh schedules, ensuring that data is regularly updated without manual intervention. This feature is essential for maintaining the accuracy and relevance of data in reports and dashboards.
Incremental Refresh: For large data sets, incremental refresh can be configured to only update the data that has changed since the last refresh. This reduces the load on data sources and improves the performance of data refreshes.
Power BI Streaming Datasets:
Real-Time Tiles: Real-time tiles can be created in Power BI dashboards, which update automatically with live data. These tiles can display various visualizations, including line charts, bar charts, and card visuals, to show real-time metrics.
Streaming Data Analytics: Power BI integrates with Azure Stream Analytics, allowing users to set up real-time analytics on streaming data. This integration supports complex event processing, such as detecting patterns, anomalies, and trends in real time.
Integration with Azure Services:
Azure Stream Analytics: Azure Stream Analytics processes real-time data streams and outputs the results to Power BI. This integration enables complex event processing, such as aggregations, filtering, and windowed computations, to be performed on real-time data.
Azure Data Explorer: Power BI can connect to Azure Data Explorer for high-performance analytics on large volumes of streaming data. This is ideal for use cases requiring low-latency data processing, such as monitoring application performance or tracking IoT sensor data.
By leveraging these real-time data processing features, Power BI enables businesses to harness the power of real-time analytics, providing immediate insights and enhancing their ability to make timely, data-driven decisions. This capability is crucial for maintaining operational efficiency, improving customer experiences, gaining a competitive edge, and managing risks effectively.
8. DAX Functions
DAX functions are pivotal in addressing complex analytical challenges efficiently. With a thorough understanding of these functions, users can manipulate data dynamically and extract insights efficiently, enhancing decision-making processes. Here, we discuss the indispensable DAX functions, offering essential insights to optimize your analytical prowess.
Mastering DAX for Complex Calculations
Data Analysis Expressions (DAX) is a powerful formula language used in Power BI for creating custom calculations and aggregations. Mastering DAX is essential for data analysts who want to perform complex data manipulations and derive deeper insights from their data. Here’s an overview of essential DAX functions and tips for using DAX to solve complex analytical problems:
Overview of Essential DAX Functions
Aggregation Functions:
SUM: Adds up all the numbers in a column.
AVERAGE: Calculates the average of numbers in a column.
MIN/MAX: Finds the minimum or maximum value in a column.
COUNT/COUNTA: Counts the number of values or non-blank values in a column.
Filtering Functions:
CALCULATE: Evaluate an expression in a modified filter context.
FILTER: Returns a table that represents a subset of another table or expression.
Time Intelligence Functions:
DATESYTD: Returns a table containing the dates for the year to date.
PARALLELPERIOD: Returns a table that shifts a period by a specified number of intervals.
Logical Functions:
IF: Checks a condition and returns one value if true, and another if false.
SWITCH: Evaluates an expression against a list of values and returns corresponding results.
Text Functions:
CONCATENATE: Joins two text strings into one.
LEFT/RIGHT: Returns the left or right part of a text string.
Date Functions:
YEAR, MONTH, DAY**: Extracts the year, month, or day from a date.
Tips for Using DAX to Solve Complex Analytical Problems
Understand Contexts:
Row Context: The context of the current row during calculations. Essential when creating calculated columns.
Filter Context: The set of filters applied to a calculation. Essential when using measures, as it determines how filters affect the result.
Use Variables for Clarity:
Define variables using the `VAR` keyword to store intermediate results. This improves readability and performance.
Optimize Performance:
Use `SUMX` and `FILTER` wisely to avoid performance bottlenecks. Aggregate first, then filter if possible.
Avoid iterating over large tables with `EARLIER` or nested row contexts.
Leverage Time Intelligence:
Use built-in time intelligence functions to simplify date-related calculations, such as year-to-date (YTD), quarter-to-date (QTD), and month-to-date (MTD).
Debugging and Testing:
Use the DAX formula bar to test and debug formulas. Break down complex formulas into smaller parts and test them individually.
Use tools like DAX Studio to analyze query performance and optimize complex DAX formulas.
Create Reusable Measures:
Build reusable measures for common calculations. This modular approach helps maintain consistency and simplifies updates.
Document Your DAX:
Add comments to your DAX formulas to explain the logic and purpose, making it easier for others (and future you) to understand.
Combine DAX with Power Query:
Perform initial data cleaning and transformations in Power Query before applying DAX calculations. This separation of ETL and analytical logic can improve performance and manageability.
By mastering these DAX functions and applying the tips for complex problem-solving, data analysts can leverage the full power of Power BI to create sophisticated and insightful data models. This proficiency enables deeper data analysis, better reporting, and more informed decision-making.
9. Data Modeling
Data modeling is a crucial step in the data analysis process as it helps to structure and organize data for effective analysis. Robust data modeling tools like Power BI simplify the creation and management of data models, enhancing the efficiency of the data analysis process. By following best practices for data modeling, analysts can ensure that their data models are accurate, efficient, and easily understandable, enabling better insights and decision-making.
Robust Data Modeling Tools
Power BI's robust data modeling tools allow data analysts to build and manage data models effectively, ensuring that the data is structured in a way that supports insightful analysis and reporting. Here’s a comprehensive overview of building and managing data models in Power BI, along with best practices for data modeling:
Building and Managing Data Models in Power BI
Building Data Models:
Data Import and Preparation:
Power Query Editor: Use the Power Query Editor to import, clean, transform, and shape data from various sources before loading it into the data model. This step is crucial for ensuring that the data is accurate and ready for analysis.
Defining Relationships:
Creating Relationships: Establish relationships between tables to enable data to be analyzed across multiple dimensions. Relationships can be one-to-one, one-to-many, or many-to-many.
Cardinality and Cross-Filter Direction: Configure the cardinality (one-to-one, one-to-many, many-to-many) and cross-filter direction (single or both) of relationships to ensure accurate data aggregation.
Calculated Columns and Measures:
Calculated Columns: Use DAX to create calculated columns that add new data based on existing data in the table.
Measures: Create measures for dynamic aggregations and calculations that change based on the context of the data in reports.
Managing Data Models:
Data Model View:
Table Relationships: Visualize and manage relationships between tables using the data model view. This interface helps ensure that the data model is structured correctly.
Field Properties: Configure field properties, such as data types, formatting, and default summarization, to optimize the data model for analysis.
Hierarchies and Role-Based Security:
Hierarchies: Create hierarchies (e.g., Year > Quarter > Month) to simplify data exploration and analysis.
Role-Based Security: Implement row-level security (RLS) to control access to data based on user roles, ensuring that sensitive data is protected.
Best Practices for Data Modeling
Understand the Data:
Know Your Data: Gain a deep understanding of the data, including its source, structure, and relationships. This knowledge is essential for building an accurate and effective data model.
Data Profiling: Use data profiling tools to examine the data's quality, distribution, and potential issues before modeling.
Normalize Data:
Star Schema Design: Organize data into a star schema with fact tables (containing quantitative data) and dimension tables (containing descriptive attributes). This structure simplifies analysis and improves performance.
Optimize Performance:
Reduce Data Volume: Import only the necessary data and use aggregations to minimize the volume of data processed.
Efficient Relationships: Optimize relationships by ensuring they are based on indexed columns and using appropriate cardinality and cross-filter directions.
Maintain Data Integrity:
Data Validation: Implement data validation checks to ensure that the data is accurate and consistent before loading it into the model.
Consistency and Naming Conventions: Use consistent naming conventions for tables, columns, and measures to improve readability and maintainability.
Use Calculated Columns and Measures Wisely:
Calculated Columns: Use calculated columns sparingly, as they are calculated during data refreshes and can impact performance.
Measures: Prefer measures over calculated columns for dynamic calculations that depend on the context of the data in reports.
Leverage DAX for Advanced Calculations:
Advanced DAX Functions: Use advanced DAX functions to create complex calculations and aggregations that provide deeper insights.
Variables in DAX: Utilize variables to simplify and optimize DAX formulas, making them easier to read and maintain.
Implement Hierarchies and Custom Columns:
Hierarchies: Create hierarchies to enable users to drill down into data and analyze it at different levels of granularity.
Custom Columns: Use custom columns to add derived data that enhance analysis.
Regularly Review and Refine the Model:
Model Refinement: Continuously review and refine the data model to ensure it meets the evolving needs of the business and maintains optimal performance.
Feedback and Iteration: Incorporate feedback from users and stakeholders to improve the data model iteratively.
By following these best practices and utilizing Power BI's robust data modeling tools, data analysts can build and manage effective data models that support accurate and insightful analysis. A well-structured data model is the foundation for successful data analysis and reporting, enabling businesses to make data-driven decisions with confidence.
10. Report Sharing and Collaboration Tools
When it comes to efficient report distribution and team collaboration, having the right tools can make all the difference. From methods for sharing reports and dashboards to collaboration features for team-based data analysis, there are many report-sharing and collaboration tools available that can streamline workflows and enhance overall productivity. Whether you are working on a small project or with a large team, these tools can help facilitate seamless communication and information sharing.
Efficient Report Distribution and Team Collaboration
Power BI offers various tools and features that facilitate efficient report distribution and collaboration among team members. These tools enhance team-based data analysis and ensure that insights are shared seamlessly across the organization. Here’s an in-depth look at the methods for sharing reports and dashboards and the collaboration features in Power BI:
Methods for Sharing Reports and Dashboards
Power BI Service (PowerBI.com):
Publishing Reports: After creating reports in Power BI Desktop, you can publish them to the Power BI Service. This makes the reports accessible to others in your organization via the web.
Dashboards: Create dashboards by pinning visuals from reports. Dashboards provide a consolidated view of key metrics and can include tiles from multiple reports and data sources.
Sharing Links:
Share Report: Use the Share button to send a link to the report or dashboard via email. Recipients can view and interact with the content in the Power BI Service.
Embed in Websites: Generate embed codes to integrate Power BI reports and dashboards into internal websites, portals, or SharePoint pages.
Power BI Mobile App:
Mobile Access: Access and interact with Power BI reports and dashboards on the go using the Power BI Mobile app, available for iOS and Android devices. This ensures that insights are accessible anytime, anywhere.
Export Options:
Export to PDF/PPT: Export reports to PDF or PowerPoint formats for offline viewing or sharing in presentations.
Excel Export: Export data from visuals to Excel for further analysis or sharing with users who prefer working in Excel.
Collaboration Features for Team-Based Data Analysis
Workspaces:
Creating Workspaces: Create workspaces in the Power BI Service to organize and collaborate on reports, dashboards, and datasets. Workspaces serve as shared environments where team members can work together on Power BI content.
Workspace Roles: Assign different roles (Admin, Member, Contributor, Viewer) to workspace members to control access and permissions.
Comments and Annotations:
Commenting: Add comments to reports and dashboards to discuss insights, share feedback, and collaborate with team members. Tag specific users in the comments to notify them directly.
Annotations: Use the annotation tools to highlight important areas of visuals and add notes directly to the report.
Dataflows:
Shared Dataflows: Create and share dataflows in Power BI to provide a centralized, reusable data preparation logic that can be used across multiple reports and datasets. This ensures consistency and reduces duplication of effort.
Integration with Microsoft Teams:
Teams Integration: Embed Power BI reports and dashboards directly into Microsoft Teams channels to enhance collaboration. This integration allows team members to discuss insights and make data-driven decisions within the Teams environment.
Alerts and Subscriptions:
Data Alerts: Set up data alerts on specific visuals to receive notifications when data reaches certain thresholds. Alerts can be configured to send emails or push notifications.
Email Subscriptions: Create email subscriptions to automatically send updated reports or dashboards to specified users on a regular schedule.
Collaboration with External Users:
Guest Access: Share Power BI content with external users (guests) by granting them access to specific reports, dashboards, or workspaces. External users can interact with shared content without needing a full Power BI license.
Version Control:
Version History: Maintain version control of reports and datasets by using Power BI's version history feature. This allows you to track changes, revert to previous versions, and ensure that the latest version is always available.
These capabilities ensure that insights are shared seamlessly, collaboration is enhanced, and decision-making is data-driven and informed.
Conclusion
In 2025, Power BI will enhance data analysis with advanced features for analysts. Key features include a user-friendly interface, advanced data visualizations, and customizable visuals for tailored presentations. Interactive dashboards improve storytelling, while seamless data connectivity ensures real-time updates. AI capabilities enhance insights, and real-time analytics support quick decision-making. Mastering DAX functions enables complex calculations, and robust data modeling tools facilitate efficient analysis. Finally, report-sharing and collaboration tools promote teamwork in data analysis. Collectively, these features empower analysts to transform data into actionable insights and make confident, data-driven decisions.
Get a Free Consultation
Infiniticube offers a free consultation for all the Power BI services discussed above. Our experts are ready to help you leverage advanced data visualization, AI capabilities, real-time analytics, and seamless cloud integration to transform your business insights.
He is working with infiniticube as a Digital Marketing Specialist. He has over 3 years of experience in Digital Marketing. He worked on multiple challenging assignments.
Our newsletter is finely tuned to your interests, offering insights into AI-powered solutions, blockchain advancements, and more. Subscribe now to stay informed and at the forefront of industry developments.


 June 27, 2025
 Balbir Kumar Singh
 0
0


Leave a Reply