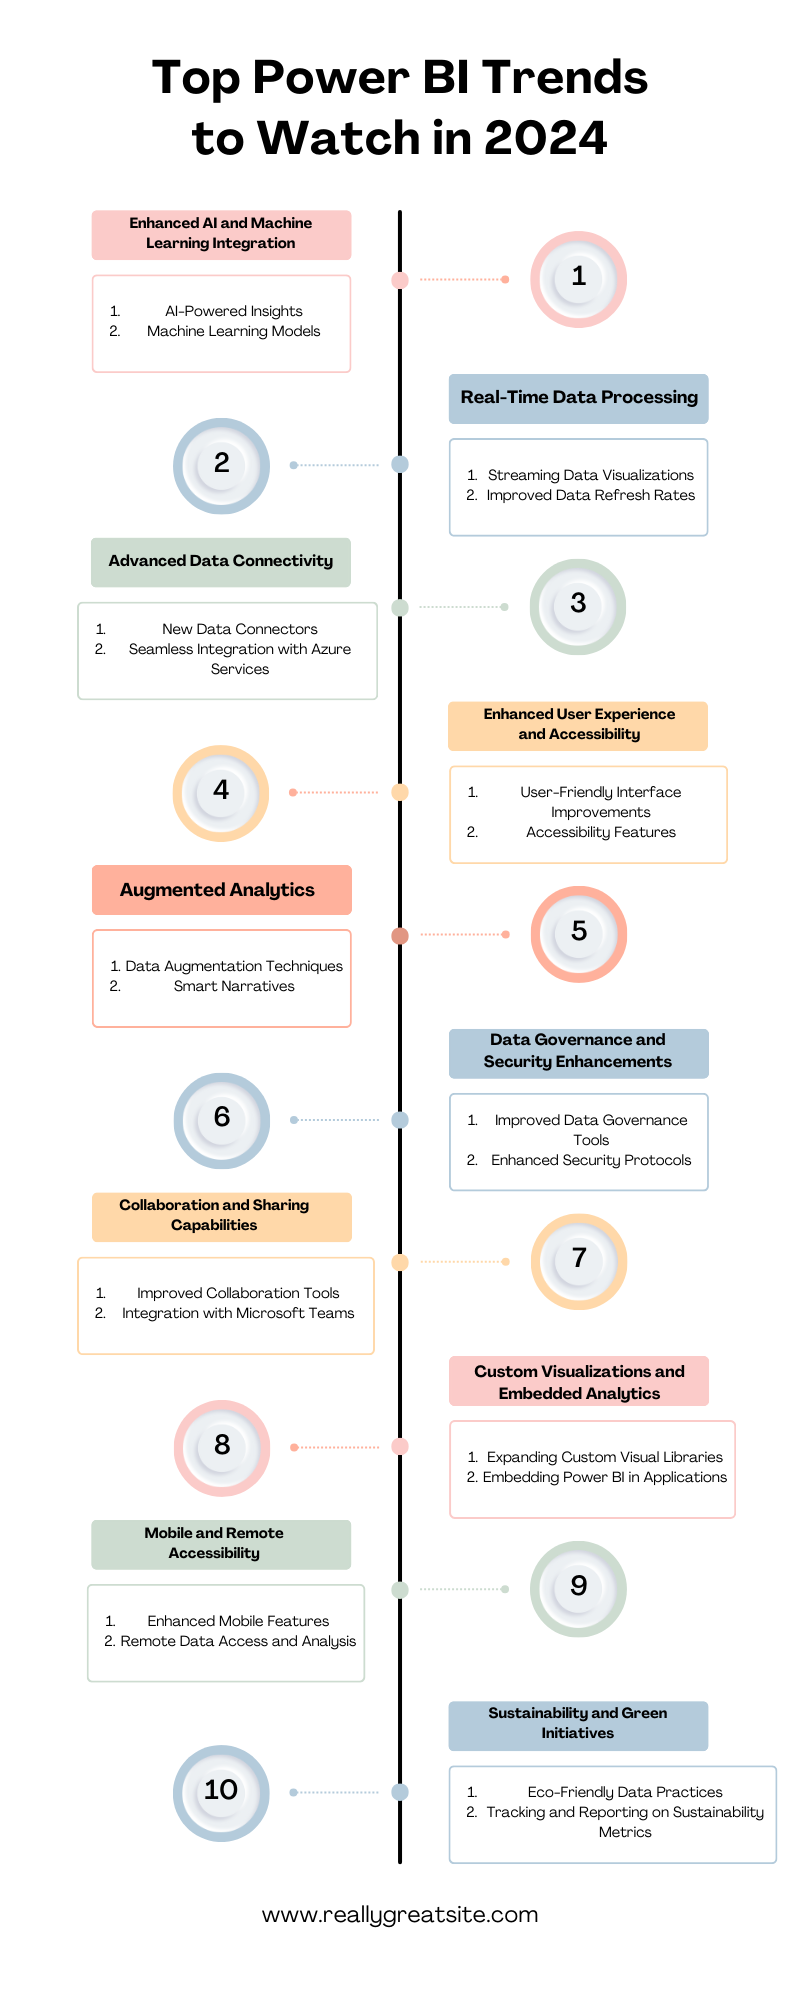
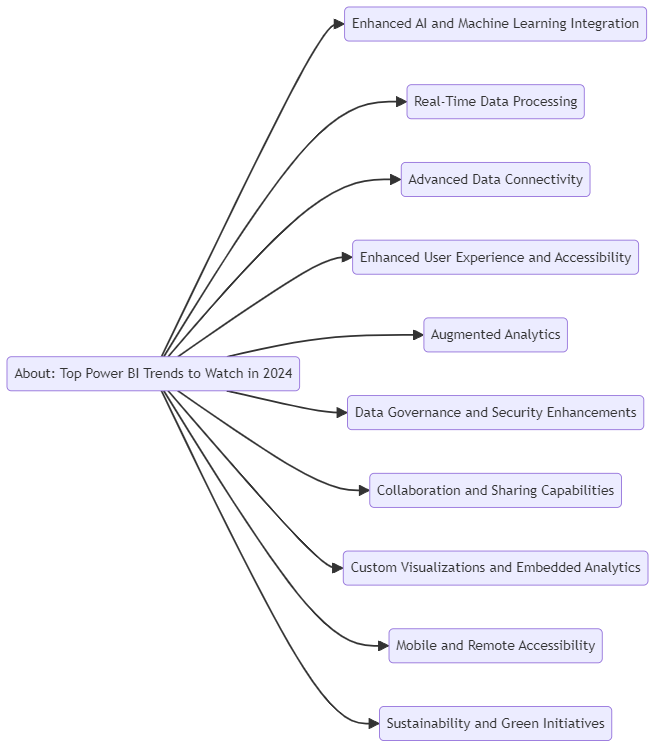
The article discussesPower BI trends and data visualization trends, emphasizing its importance in business intelligence. Key features include customizable Azure Maps, DAX query views, augmented analytics, and natural language processing, enhancing data analysis efficiency.
Real-time analytics, self-service tools, and predictive features are vital for informed decision-making. User experience improvements, such as mobile layout optimization and intuitive formatting options, streamline report creation.
Automated insights generated through generative AI revolutionize workflows, integrating advanced technologies like AI and machine learning. Recent updates allow for larger semantic model downloads and improved report management, encouraging businesses to adopt these innovations for a competitive advantage.
Enhanced AI and Machine Learning Integration
AI-Powered Insights
Automated Insights Generation
Introduction to Automated Insights:
Automated insights in Power BI leverage artificial intelligence to analyze data and identify patterns, trends, and anomalies without manual intervention.
This feature helps users quickly uncover actionable insights from large datasets, streamlining the decision-making process.
How Automated Insights Work:
Power BI uses advanced algorithms to scan datasets and generate insights.
It looks for significant changes, correlations, and outliers, presenting these findings in an easily digestible format.
Users can customize the parameters and scope of the analysis to focus on specific data points or trends.
Benefits of Automated Insights:
Time Efficiency: Saves time by automating the data analysis process, allowing users to focus on strategic tasks.
Accuracy: Reduces the risk of human error in data interpretation.
Accessibility: Makes data-driven insights accessible to non-technical users, democratizing data analysis across the organization.
NLP in Power BI allows users to interact with their data using natural language queries.
This feature simplifies the process of data retrieval and analysis, making it more intuitive for users who may not be familiar with complex query languages.
How NLP Enhances User Experience:
Users can type questions in plain English, and Power BI interprets these queries to fetch the relevant data and visualizations.
Example queries might include "What were our sales figures last quarter?" or "Show me the trend of customer churn over the past year."
Implementation and Usage:
Power BI's Q&A feature uses NLP to process user queries and provide instant visual responses.
The system improves over time as it learns from user interactions and adapts to the specific terminology and context of the business.
Advantages of NLP in Power BI:
User-Friendly: Lowers the barrier to entry for data analysis, allowing more team members to engage with data.
Speed: Provides quick answers to ad-hoc questions, enhancing agility in decision-making.
Customization: Allows for creating custom Q&A suggestions and synonyms to match the unique language of the business better.
Machine Learning Models
Integrating Custom ML Models within Power BI
Introduction to Custom ML Models:
Power BI enables the integration of custom machine learning (ML) models, allowing businesses to apply sophisticated analytics directly within their reports and dashboards.
Users can create ML models in Azure Machine Learning or other platforms and integrate them into Power BI for seamless data analysis.
Steps for Integration:
Model Creation: Develop and train ML models using tools like Azure Machine Learning, Python, or R.
Model Deployment: Deploy the trained model as a web service or API.
Integration: Use Power BI’s integration features to connect to the deployed model, allowing it to process data and return predictions or classifications.
Use Cases for Custom ML Models:
Customer Segmentation: Classify customers into segments based on behavior and demographics.
Churn Prediction: Predict which customers are likely to churn and take proactive measures to retain them.
Fraud Detection: Identify potentially fraudulent transactions or activities.
Predictive Analytics and Forecasting
Overview of Predictive Analytics:
Predictive analytics involves using historical data, statistical algorithms, and ML techniques to predict future outcomes.
In Power BI, predictive analytics can provide valuable foresight into trends and patterns, aiding strategic planning.
How Predictive Analytics Works in Power BI:
Power BI can integrate with predictive models to apply them to datasets, generating future projections based on historical trends.
Users can visualize these predictions in the form of charts, graphs, and other visual aids.
Benefits of Predictive Analytics:
Proactive Decision-Making: Helps businesses anticipate future events and make informed decisions.
Resource Optimization: Allows for better allocation of resources based on predicted demand or trends.
Competitive Advantage: Provides insights that can give a business an edge over competitors by staying ahead of market changes.
Forecasting Capabilities:
Built-in Forecasting Tools: Power BI offers built-in forecasting features that allow users to generate future data points based on historical data.
Customization Options: Users can adjust forecasting parameters such as confidence intervals and seasonality to refine predictions.
Visual Representation: Forecasts are presented visually, making it easy to understand and communicate future trends.
By integrating enhanced AI and machine learning capabilities, Power BI is poised to revolutionize how businesses analyze and interpret their data, providing deeper insights, greater accuracy, and improved decision-making capabilities.
Real-time data processing is revolutionizing the way we interact with information. With real-time data processing, there is no delay, and data is analyzed as it comes in, making it possible to act on insights instantaneously.
This allows for quicker decision-making and a more accurate understanding of trends. Real-time data processing is especially crucial in industries where seconds count, such as finance, healthcare, and logistics.
The capacity to have up-to-the-second insights can provide a crucial competitive edge in today’s fast-paced world. Thank you real-time data processing for transforming the way we understand and react to data!
Streaming Data Visualizations
Benefits of Real-Time Dashboards
Immediate Insights:
Real-time dashboards provide instant visibility into current data, allowing businesses to make timely decisions.
They offer up-to-the-minute updates, enabling organizations to respond quickly to changing conditions.
Increased Responsiveness:
By displaying live data, real-time dashboards help identify and address issues as they arise.
This immediate feedback loop enhances operational efficiency and minimizes downtime.
Enhanced Monitoring:
Continuous data streaming allows for ongoing monitoring of key performance indicators (KPIs).
Users can set up alerts and notifications for specific thresholds, ensuring that critical metrics are always in view.
Better Customer Experience:
In customer-facing applications, real-time dashboards can improve service delivery by providing up-to-date information.
For example, in customer support, agents can access the latest customer data to offer more accurate and personalized assistance.
Use Cases in Various Industries
Finance:
Market Monitoring: Financial institutions use real-time dashboards to track stock prices, currency exchange rates, and market indices.
Risk Management: Real-time data helps in monitoring trading activities and identifying potential risks or anomalies instantly.
Retail:
Inventory Management: Retailers can monitor stock levels in real-time to prevent stockouts and overstock situations.
Sales Tracking: Live sales data allows retailers to track performance, identify trends, and optimize promotions on the fly.
Healthcare:
Patient Monitoring: Real-time dashboards are used in hospitals to monitor patient vitals and alert medical staff to any critical changes.
Resource Allocation: Healthcare providers can track the availability of beds, equipment, and personnel to manage resources efficiently.
Manufacturing:
Production Monitoring: Manufacturers use real-time dashboards to track production line performance and detect issues early.
Quality Control: Live data helps in monitoring product quality and implementing corrective actions immediately.
Transportation and Logistics:
Fleet Management: Real-time tracking of vehicles allows logistics companies to optimize routes and improve delivery times.
Supply Chain Visibility: Continuous data streaming provides insights into the supply chain, helping to manage disruptions and delays.
Improved Data Refresh Rates
Enhancements in Data Connectivity and Refresh
Increased Data Sources:
Power BI has expanded its range of data connectors, enabling users to connect to a broader array of real-time data sources.
This includes direct connections to streaming data services, IoT devices, and other real-time data platforms.
Faster Data Refresh Intervals:
Power BI has improved its data refresh capabilities, allowing for more frequent updates to dashboards and reports.
Users can set refresh intervals to match their specific needs, ranging from minutes to seconds, depending on the data source and requirements.
Incremental Refresh:
Incremental refresh allows Power BI to update only the data that has changed, rather than refreshing the entire dataset.
This reduces the load on data sources and speeds up the refresh process, ensuring that dashboards remain responsive and up-to-date.
Optimized Query Performance:
Power BI has implemented performance optimizations for real-time queries, reducing latency and improving the speed of data retrieval.
These enhancements ensure that users receive the latest data without significant delays.
Data Gateway Improvements:
Enhancements to Power BI's on-premises data gateway facilitate more reliable and faster data connectivity.
These improvements ensure seamless integration between on-premises data sources and Power BI’s cloud services.
Scalability:
Power BI has improved its ability to handle large volumes of streaming data, making it suitable for enterprise-scale applications.
The platform can scale to accommodate the needs of businesses as they grow and their data requirements increase.
By leveraging real-time data processing capabilities, businesses can gain a significant competitive advantage. Power BI's enhancements in streaming data visualizations and data refresh rates enable organizations to maintain a continuous flow of up-to-date information, facilitating better decision-making and more efficient operations.
From cloud computing to artificial intelligence, advanced data connectivity is propelling business innovation to new heights. With faster speeds and enhanced security measures, the possibilities seem endless. Businesses are now able to leverage real-time analytics to make informed decisions quickly. This is all thanks to the power of advanced data connectivity.
Smart devices are becoming more interconnected, creating seamless and immersive user experiences. The future is here, and with advanced data connectivity at the helm, there’s no telling how far we can go. So buckle up, because the speed of innovation is only going to increase from here on out.
New Data Connectors
Introduction of New Connectors for Diverse Data Sources
Expanding the Ecosystem:
Power BI continuously adds new data connectors, broadening the scope of data sources that can be integrated into its platform.
These connectors facilitate seamless data integration from a wide variety of systems, enhancing the versatility of Power BI.
Types of New Connectors:
Cloud Services: Connectors for cloud-based applications and services, such as Salesforce, Google Analytics, and Adobe Analytics.
Databases: New connectors for popular databases like Snowflake, Amazon Redshift, and Google BigQuery.
APIs: Enhanced connectors for REST APIs and other web services, allowing for custom data integrations.
Enterprise Systems: Connectors for enterprise resource planning (ERP) systems, customer relationship management (CRM) systems, and other business applications.
Benefits of Diverse Data Connectors:
Unified Data View: Ability to consolidate data from multiple sources into a single, comprehensive view.
Data Enrichment: Combining data from various sources can provide richer insights and more context for analysis.
Increased Flexibility: Organizations can choose the best data sources for their specific needs, without being limited by connectivity issues.
Real-World Applications:
Marketing Analytics: Integrating data from different marketing platforms (e.g., Google Ads, Facebook Ads) to get a holistic view of campaign performance.
Sales and CRM: Connecting CRM systems (e.g., Salesforce, HubSpot) with Power BI to analyze sales pipelines and customer interactions.
Operations: Linking operational systems and databases to monitor performance and optimize processes.
Seamless Integration with Azure Services
Leveraging Azure Synapse, Data Lake, and Other Services
Azure Synapse Analytics:
Integrated Analytics Platform: Azure Synapse combines big data and data warehousing capabilities, providing a unified analytics platform.
Direct Integration: Power BI seamlessly integrates with Azure Synapse, enabling users to leverage its advanced analytics features.
Data Exploration and Analysis: Users can perform large-scale data exploration and analysis directly within Power BI, utilizing Synapse's powerful processing capabilities.
Azure Data Lake:
Scalable Data Storage: Azure Data Lake provides scalable and secure data storage for large volumes of structured and unstructured data.
Data Lake Integration: Power BI can connect to Azure Data Lake, allowing users to access and analyze data stored in the lake.
Data Preparation: Users can prepare and transform data within Azure Data Lake using tools like Azure Data Factory before importing it into Power BI.
Azure Machine Learning:
Advanced Analytics and AI: Integration with Azure Machine Learning enables users to apply machine learning models to their data directly within Power BI.
Predictive Insights: Users can generate predictive insights and incorporate them into their Power BI reports and dashboards.
Azure Stream Analytics:
Real-Time Data Processing: Azure Stream Analytics processes streaming data in real time, making it available for analysis in Power BI.
Event Hubs Integration: Power BI can connect to Azure Event Hubs, ingesting real-time data streams for live dashboards and visualizations.
Azure Cognitive Services:
AI Capabilities: Azure Cognitive Services provides AI capabilities such as natural language processing, image recognition, and sentiment analysis.
Enhancing Power BI Reports: Users can enhance their Power BI reports with insights derived from cognitive services, adding more depth to their analyses.
Benefits of Azure Integration:
Enhanced Performance: Leveraging Azure services can significantly enhance the performance and scalability of Power BI solutions.
Comprehensive Analytics: Combining Power BI with Azure's advanced analytics and AI capabilities provides a comprehensive solution for data analysis.
Cost Efficiency: Azure services offer flexible pricing models, allowing businesses to scale their analytics infrastructure cost-effectively.
Practical Use Cases:
Financial Services: Using Azure Synapse and Power BI to analyze large financial datasets for risk assessment and fraud detection.
Healthcare: Integrating Azure Data Lake with Power BI to store and analyze patient data, improving healthcare outcomes.
Retail: Combining Azure Machine Learning with Power BI to predict customer behavior and optimize inventory management.
By introducing new data connectors and leveraging seamless integration with Azure services, Power BI enhances its capabilities to handle diverse and complex data sources. These advancements in data connectivity empower organizations to harness the full potential of their data, enabling deeper insights and more informed decision-making.
In today’s digital age, providing an enhanced user experience and accessibility is paramount. By focusing on creating websites and applications that are intuitive, inclusive, and easy to navigate, businesses can captivate their audience and stand out from the competition.
See What Makes These Power BI Dashboards The Best in The Business!
Including features like alt text for images, captioning for videos, and keyboard navigation can make a significant difference in ensuring all users have a positive experience. Ultimately, embracing these principles is not just about meeting legal requirements but also about showcasing a commitment to inclusivity and user-centric design.
User-Friendly Interface Improvements
Updates to the Power BI Interface for Better Usability
Streamlined Navigation:
Simplified Menus: Power BI has updated its menus and navigation to make it easier for users to find the tools and features they need.
Quick Access Toolbar: A customizable toolbar allows users to add their most frequently used actions for faster access.
Enhanced Dashboard Customization:
Drag-and-Drop Functionality: Improved drag-and-drop features make it easier to create and customize dashboards and reports.
Responsive Design: Dashboards now adapt more seamlessly to different screen sizes and resolutions, providing a consistent experience across devices.
Improved Data Visualizations:
New Visualization Options: Introduction of new and enhanced visualizations, such as advanced charts and interactive graphs.
Customization Features: Expanded options for customizing the look and feel of visualizations, including color schemes, fonts, and layouts.
Optimized Report Building:
Templates and Themes: New templates and themes help users quickly create professional-looking reports.
Enhanced Formatting Tools: More robust formatting options allow for precise control over report elements.
User Experience Enhancements:
Guided Tours and Tutorials: Interactive guides and tutorials help new users get up to speed quickly.
Contextual Help: In-app help and tooltips provide instant assistance with features and functions.
Accessibility Features
New Tools and Features to Make Power BI More Accessible
Keyboard Navigation:
Full Keyboard Support: Power BI has enhanced its support for keyboard navigation, allowing users to navigate and interact with reports and dashboards without a mouse.
Shortcuts and Hotkeys: Introduction of new keyboard shortcuts and hotkeys for common actions to improve efficiency for power users.
Screen Reader Compatibility:
Improved Screen Reader Support: Updates to ensure that Power BI works seamlessly with screen readers, providing descriptive text for visual elements.
Accessible Dashboards: Enhanced accessibility for dashboards, making them more usable for individuals with visual impairments.
Color Contrast and Themes:
High Contrast Themes: New high-contrast themes improve visibility for users with low vision or color blindness.
Customizable Color Settings: Users can customize color settings to ensure that all visual elements meet their specific accessibility needs.
Text and Font Adjustments:
Adjustable Font Sizes: Users can increase or decrease font sizes across the interface for better readability.
Readable Fonts: Introduction of new fonts designed for better readability and reduced eye strain.
Voice Commands and Dictation:
Voice-Activated Commands: Integration of voice commands for navigating and interacting with Power BI, enhancing usability for users with mobility impairments.
Dictation Features: Support for dictation in text fields, allowing users to input data and annotations by voice.
Alternative Text for Visual Elements:
Alt Text for Images and Graphics: Users can add alternative text descriptions to images and graphics, making visual data accessible to screen readers.
Enhanced Chart Descriptions: Detailed descriptions for charts and graphs to provide context and insights for users relying on screen readers.
Compliance with Accessibility Standards:
WCAG Compliance: Power BI continues to align with the Web Content Accessibility Guidelines (WCAG) to ensure broad accessibility.
Regular Audits and Updates: Ongoing accessibility audits and updates to maintain and improve accessibility features.
Training and Resources:
Accessibility Training: Power BI offers training materials and resources to help users understand and implement accessibility best practices in their reports and dashboards.
Community Support: Active user community and forums where users can share tips and solutions for accessibility challenges.
By focusing on user-friendly interface improvements and enhanced accessibility features, Power BI aims to provide a more inclusive and intuitive experience for all users. These enhancements not only make the platform more accessible to individuals with disabilities but also improve overall usability and efficiency for everyone.
Augmented analytics is revolutionizing the way businesses use data, combining machine learning and artificial intelligence to enhance human intelligence. By automating data insights and simplifying complex analytical processes, augmented analytics allows decision-makers to focus on strategic planning rather than getting lost in data.
This transformative technology empowers users of all levels to analyze data, understand patterns, and derive actionable insights effortlessly. As organizations continue to leverage augmented analytics solutions, they are sure to uncover valuable insights that can drive innovation and success. Augmented analytics truly exemplifies the power of blending human expertise with machine intelligence.
Data Augmentation Techniques
Enriching Data with Additional Context and Insights
Integrating External Data Sources:
Third-Party Data Integration: Power BI can connect to external data sources such as social media platforms, weather data services, and economic databases to enrich existing datasets.
APIs and Web Services: Using APIs to pull in additional data from various web services to provide a more comprehensive analysis.
Enhancing Data Quality:
Data Cleaning and Preparation: Utilizing Power BI's data transformation tools to clean and prepare data, removing inconsistencies and ensuring high-quality data.
Data Profiling: Analyzing data for patterns and anomalies to ensure that it is accurate and reliable.
Contextual Enrichment:
Geospatial Data Integration: Adding geographic data to visualizations to provide spatial context and insights, such as mapping sales data to specific regions.
Temporal Data Integration: Incorporating time-based data to analyze trends over time, enabling users to see how metrics evolve.
Advanced Analytics:
Sentiment Analysis: Using natural language processing (NLP) to analyze text data and gauge sentiment, enriching customer feedback and social media data with emotional context.
Behavioral Analysis: Tracking and analyzing user behavior data to understand patterns and predict future actions.
Business-Specific Context:
Industry Benchmarks: Comparing internal data against industry benchmarks and standards to identify strengths and areas for improvement.
Custom Metrics and KPIs: Defining custom metrics and key performance indicators (KPIs) that are specific to the business context, providing more relevant insights.
Automated Data Discovery:
AI-Powered Data Insights: Leveraging AI to automatically discover patterns, correlations, and outliers in the data, providing deeper insights with minimal effort.
Anomaly Detection: Identifying unusual patterns or deviations in the data that may indicate significant events or issues.
Smart Narratives
Automatically Generated Narratives for Visualizations
Introduction to Smart Narratives:
AI-Driven Storytelling: Power BI’s Smart Narratives feature uses artificial intelligence to generate written summaries of data visualizations, making complex data easier to understand.
Automated Insights: The tool automatically identifies key insights and trends, and presents them in a narrative format.
How Smart Narratives Work:
Contextual Analysis: Analyze the context of the data being visualized to generate relevant narratives.
Dynamic Text Generation: Creates dynamic text that updates as the data changes, ensuring that the narratives always reflect the most current insights.
Benefits of Smart Narratives:
Enhanced Data Interpretation: Makes it easier for users to interpret and understand complex data visualizations without requiring deep technical knowledge.
Time Efficiency: Saves time by automating the process of data analysis and reporting, allowing users to focus on decision-making.
Improved Communication: Provides clear and concise summaries that can be easily shared with stakeholders, improving communication and collaboration.
Customization Options:
Tailored Narratives: Users can customize the generated narratives to include specific business terminology and focus on particular insights.
Formatting and Styling: Allows for customization of the appearance of narratives to match the style of the report or dashboard.
Use Cases for Smart Narratives:
Executive Summaries: Generating high-level summaries of business performance for executives and decision-makers.
Sales Reports: Automatically generate narratives for sales performance reports, highlighting key trends and variances.
Operational Dashboards: Providing contextual insights for operational data, such as production metrics or customer service statistics.
Integration with Other Features:
Interactive Visuals: Smart Narratives can be integrated with interactive visuals, updating the text as users explore different aspects of the data.
Export and Sharing: Narratives can be exported along with the visualizations, making it easy to share comprehensive reports with stakeholders.
Continuous Improvement:
Learning from Feedback: The AI behind Smart Narratives can learn from user feedback and interactions, improving the quality and relevance of the generated text over time.
Staying Current: Power BI continuously updates and enhances the Smart Narratives feature to keep up with advancements in AI and user needs.
By incorporating advanced data augmentation techniques and Smart Narratives, Power BI significantly enhances its augmented analytics capabilities. These features provide users with deeper insights, richer context, and more accessible interpretations of their data, empowering them to make better-informed decisions and communicate their findings more effectively.
Data governance and security enhancements are crucial aspects of today’s digital landscape. The advancements in technology have brought about new opportunities for businesses, but they also come with challenges, particularly in ensuring the protection of sensitive information.
With the rise of cyber threats, businesses must continuously enhance their data governance practices and security measures to mitigate risks effectively.
Implementing robust data governance and security protocols can provide a shield against potential breaches and instill confidence in customers and stakeholders. By staying vigilant and proactive, businesses can safeguard their data assets and uphold their reputation in the market.
Improved Data Governance Tools
New Features for Data Management and Compliance
Centralized Data Management:
Data Cataloging: Power BI has introduced enhanced data cataloging features, allowing organizations to maintain a comprehensive inventory of their data assets.
Data Lineage Tracking: Users can now trace the origin and flow of data through various stages, ensuring transparency and understanding of data transformations.
Data Quality Monitoring:
Automated Data Quality Checks: New tools for setting up automated checks to monitor data quality and detect anomalies or inconsistencies.
Data Profiling: Enhanced data profiling capabilities to assess data quality, identify patterns, and ensure data accuracy and completeness.
Compliance and Regulatory Adherence:
Data Classification: Power BI now supports data classification tags, helping organizations categorize and label data according to sensitivity and compliance requirements.
Audit Trails: Improved audit logging features provide detailed records of data access, modifications, and usage, aiding in compliance with regulations such as GDPR and CCPA.
Data Access Control:
Role-Based Access: Enhanced role-based access control (RBAC) to define and enforce granular permissions for different user roles.
Data Masking: Introduction of data masking features to protect sensitive information by obfuscating data values in reports and dashboards.
Governance Policies and Rules:
Policy Management: New tools for defining and enforcing data governance policies across the organization, ensuring consistent data management practices.
Data Usage Monitoring: Capabilities to monitor and analyze data usage patterns, helping organizations understand how data is being used and by whom.
Metadata Management:
Enhanced Metadata: Improved metadata management tools to document and manage data attributes, definitions, and relationships.
Metadata Integration: Integration with external metadata repositories and tools to provide a unified view of metadata across the organization.
Enhanced Security Protocols
Advances in Data Protection and User Authentication
Advanced Encryption:
Data Encryption: Power BI now offers enhanced encryption protocols for data at rest and in transit, ensuring that data is protected from unauthorized access.
Encryption Key Management: Improved management of encryption keys, including support for customer-managed keys and integration with key management services.
User Authentication:
Multi-Factor Authentication (MFA): Strengthened multi-factor authentication options to provide an additional layer of security for user logins.
Single Sign-On (SSO): Enhanced single sign-on capabilities to streamline user access while maintaining strong security controls.
Network Security:
Virtual Network (VNet) Integration: Power BI supports integration with Azure Virtual Networks (VNets), enabling secure connections to on-premises data sources and cloud services.
Private Endpoints: Introduction of private endpoints to restrict network access to Power BI services, ensuring data remains within the organization's secure network.
Threat Detection and Monitoring:
Anomaly Detection: Advanced threat detection tools to identify and alert on suspicious activities or unusual access patterns.
Security Analytics: Integration with security information and event management (SIEM) systems for comprehensive security monitoring and analysis.
Data Loss Prevention (DLP):
DLP Policies: Implementation of data loss prevention policies to identify, monitor, and protect sensitive data from accidental or malicious exfiltration.
Real-Time Alerts: Real-time alerts and notifications for potential data breaches or policy violations, enabling prompt response and mitigation.
Compliance and Certification:
Industry Certifications: Power BI maintains compliance with industry standards and certifications, such as ISO 27001, SOC 2, and HIPAA.
Compliance Dashboards: New compliance dashboards provide visibility into the organization’s compliance status and help track adherence to regulatory requirements.
User and Access Management:
Identity and Access Management (IAM): Enhanced IAM features to manage user identities and control access to data and resources.
Conditional Access: Support for conditional access policies to enforce access controls based on user conditions, such as location, device, or role.
Security Training and Awareness:
User Training: Power BI offers training and resources to educate users about security best practices and the importance of data protection.
Security Awareness Campaigns: Regular security awareness campaigns to keep users informed about the latest security threats and how to mitigate them.
By enhancing data governance tools and security protocols, Power BI provides a more secure and compliant environment for data management and analysis. These improvements help organizations protect their data assets, ensure regulatory compliance, and build trust with stakeholders by demonstrating a strong commitment to data security and governance.
Collaboration and Sharing Capabilities
Collaboration and sharing capabilities have revolutionized the way teams work. By leveraging these functionalities, teams can seamlessly collaborate, share knowledge, and simplify project management. These capabilities break down communication barriers and facilitate real-time engagement, fostering a sense of teamwork and camaraderie.
The ability to effortlessly share files and documents ensures that everyone is on the same page, resulting in increased productivity and efficiency. Truly, collaboration and sharing capabilities are game-changers in the modern workplace, enabling teams to achieve unprecedented levels of success.
Improved Collaboration Tools
New Features for Team Collaboration and Sharing Insights
Enhanced Report Sharing:
Link Sharing: Simplified sharing of reports and dashboards via shareable links, allowing easy distribution within and outside the organization.
Access Permissions: Advanced settings to control who can view, edit, or share reports, ensuring appropriate access levels for different users.
Collaborative Workspaces:
Team Workspaces: Dedicated workspaces for teams to collaborate on Power BI projects, including shared datasets, reports, and dashboards.
Real-Time Co-Authoring: Multiple users can now collaborate in real-time on the same report or dashboard, making changes simultaneously and seeing updates instantly.
Commenting and Annotations:
In-Report Comments: Users can add comments directly on reports and visualizations, facilitating discussions and feedback within the context of the data.
Annotation Tools: New annotation features allow users to highlight and mark specific data points or trends, providing clearer insights during presentations or reviews.
Notifications and Alerts:
Activity Alerts: Users receive notifications about changes or updates to shared reports, ensuring everyone stays informed about the latest data insights.
Custom Alerts: Set up custom alerts for specific data thresholds or changes, enabling proactive monitoring and response to key metrics.
Version Control:
Report Versioning: Track changes and maintain version histories of reports and dashboards, allowing users to revert to previous versions if needed.
Change Tracking: Detailed logs of modifications made to reports, including who made the changes and when, enhancing accountability and transparency.
Integration with Other Tools:
Office 365 Integration: Seamless integration with other Office 365 tools, such as OneDrive and SharePoint, for storing and sharing Power BI files.
Email Sharing: Directly share reports and insights via email, embedding visualizations within email messages for easy viewing by recipients.
Integration with Microsoft Teams
Streamlining Power BI Use within Teams for Better Collaboration
Embedded Reports and Dashboards:
Power BI Tabs: Add Power BI reports and dashboards as tabs within Microsoft Teams channels, providing quick access to data insights directly within the team’s workspace.
Interactive Visuals: Embedded Power BI visuals in Teams are fully interactive, allowing team members to explore and analyze data without leaving Teams.
Collaboration and Discussion:
Integrated Chat: Discuss Power BI insights directly within Teams chats or channels, linking specific reports or visualizations to conversations for context.
@Mentions: Use @mentions to notify specific team members about important insights or required actions related to Power BI data.
Automated Workflows:
Power Automate Integration: Create automated workflows using Power Automate to trigger actions based on Power BI data, such as sending alerts or updating records in other systems.
Task Management: Link Power BI insights to tasks in Microsoft Planner or To-Do, enabling team members to track and manage action items stemming from data insights.
Meeting and Presentation Enhancements:
Live Data in Meetings: Share live Power BI reports and dashboards during Teams meetings, allowing participants to view and interact with real-time data.
Presenter Mode: Use presenter mode to highlight and explain key data points during meetings, making data-driven discussions more effective.
Security and Compliance:
Unified Access Management: Manage access to Power BI reports and Teams channels using the same identity and access management controls, ensuring consistent security policies.
Compliance Features: Leverage Microsoft Teams’ compliance and governance features, such as data retention policies and eDiscovery, for managing Power BI content shared within Teams.
Mobile Collaboration:
Teams Mobile App: Access and collaborate on Power BI reports from the Teams mobile app, ensuring that users can stay connected and informed while on the go.
Mobile Notifications: Receive notifications about Power BI updates and activities directly on mobile devices, keeping users engaged and responsive.
By enhancing collaboration tools and integrating Power BI with Microsoft Teams, Power BI significantly improves the way teams work together and share insights. These features facilitate real-time collaboration, streamline workflows, and ensure that data-driven decisions are made more efficiently and effectively.
Custom Visualizations and Embedded Analytics
Custom visualizations and embedded analytics are revolutionizing the way businesses interpret and utilize their data. With the ability to tailor visualizations to specific needs, organizations can truly unlock the power of their data.
Whether it’s creating interactive dashboards or embedding analytics directly into applications, the possibilities are truly endless. Custom visualizations and embedded analytics empower decision-makers to gain valuable insights at their fingertips.
By harnessing these innovative tools, businesses can stay ahead of the curve and make data-driven decisions with confidence. Get ready to take your data analysis to the next level with custom visualizations and embedded analytics!
Expanding Custom Visual Libraries
New Custom Visualizations and Templates
Introduction to Custom Visual Libraries:
Diverse Visualization Options: Power BI’s custom visual libraries are continuously expanding, offering a wider range of visualization types to meet diverse analytical needs.
Community Contributions: Many of these visuals are developed by the Power BI community, allowing for innovative and specialized visualizations.
New Custom Visualizations:
Advanced Chart Types: Introduction of new chart types, such as sunburst charts, bullet charts, and radial bar charts, providing more ways to represent complex data.
Interactive Maps: Enhanced mapping visuals with greater interactivity, including heat maps, flow maps, and 3D maps.
Infographics and KPI Visuals: Visually appealing infographics and key performance indicator (KPI) visuals that present data in a more engaging and easily digestible format.
Visualization Templates:
Pre-Built Templates: Ready-to-use templates for common business scenarios, such as sales performance, financial analysis, and customer segmentation.
Customizable Themes: New themes that allow users to quickly apply consistent color schemes, fonts, and styles across all visualizations in a report.
Enhanced Customization Features:
Visual Scripting: Advanced users can create highly customized visuals using Power BI’s scripting capabilities with languages like DAX and R.
Visual Properties and Settings: More granular control over visual properties, such as axis scales, data labels, tooltips, and interaction settings.
User Experience Enhancements:
Drag-and-Drop Functionality: Improved drag-and-drop functionality for custom visuals, making it easier to create and modify visualizations.
Responsive Design: Custom visuals that adapt to different screen sizes and devices, ensuring a consistent user experience across platforms.
Use Cases for Custom Visuals:
Marketing Analytics: Custom visuals that showcase campaign performance, customer journey maps, and social media analytics.
Operational Dashboards: Visuals tailored to operational metrics, such as process flows, resource utilization, and productivity measures.
Financial Reporting: Advanced financial visuals for profit and loss statements, balance sheets, and cash flow analysis.
Embedding Power BI in Applications
Use Cases and Benefits of Embedded Analytics
Overview of Embedded Analytics:
Power BI Embedded: Power BI Embedded allows developers to integrate Power BI reports and dashboards directly into their applications, providing users with seamless access to analytics within the context of their workflows.
API Integration: Utilizing Power BI APIs to embed interactive reports and dashboards, enabling custom analytics solutions tailored to specific business needs.
Key Benefits of Embedded Analytics:
Enhanced User Experience: Embedding Power BI visuals within applications provides a seamless and intuitive user experience, allowing users to access insights without switching between different tools.
Real-Time Data Access: Users can view and interact with real-time data directly within their applications, enabling timely and informed decision-making.
Customization and Branding: Embedded analytics can be customized to match the look and feel of the host application, maintaining brand consistency and enhancing user engagement.
Use Cases for Embedded Analytics:
Customer Portals: Integrating Power BI reports into customer portals to provide clients with personalized insights and performance metrics.
Operational Systems: Embedding analytics into operational systems, such as ERP and CRM platforms, to provide real-time insights into business processes and customer interactions.
SaaS Applications: Enhancing software-as-a-service (SaaS) applications with embedded analytics, offering value-added features and differentiating the product in the market.
Technical Implementation:
Power BI APIs and SDKs: Utilizing Power BI REST APIs and software development kits (SDKs) for seamless integration and customization.
Security and Access Control: Implementing robust security measures, such as row-level security (RLS) and role-based access control (RBAC), to ensure that users only see data they are authorized to access.
Scalability and Performance: Leveraging Power BI’s scalable architecture to handle large datasets and high user concurrency, ensuring optimal performance.
Case Studies and Examples:
Healthcare Applications: Embedding Power BI in healthcare management systems to provide real-time insights into patient care, resource utilization, and operational efficiency.
Financial Services: Integrating Power BI into financial platforms to offer clients detailed analytics on investments, portfolio performance, and market trends.
Retail and E-Commerce: Embedding analytics into retail management systems to monitor sales performance, inventory levels, and customer behavior.
Future Trends in Embedded Analytics:
AI and Machine Learning Integration: Incorporating advanced analytics, such as predictive modeling and AI-driven insights, into embedded Power BI solutions.
Augmented Analytics: Enhancing embedded analytics with augmented capabilities, such as natural language query (NLQ) and automated insights generation, to make data analysis more accessible to non-technical users.
Cross-Platform Compatibility: Ensuring that embedded analytics solutions are compatible with various devices and platforms, including mobile and web applications.
By expanding custom visual libraries and enhancing embedded analytics capabilities, Power BI empowers users to create more insightful and visually compelling reports while seamlessly integrating analytics into their everyday workflows. These advancements facilitate better decision-making, improve user engagement, and provide a competitive edge in leveraging data insights.
Mobile and Remote Accessibility
Mobile and remote accessibility are game-changers in the digital era, empowering users worldwide. The ability to access and interact with content on the go has revolutionized the way we live, work, and communicate. Whether it’s checking emails on the train or joining a virtual meeting from a coffee shop, the convenience and flexibility of mobile and remote accessibility are unparalleled.
With advancements in technology, staying connected is easier than ever before. Embracing these tools can enhance productivity, foster collaboration, and transform the way we engage with the digital world.
Enhanced Mobile Features
Updates to the Power BI Mobile App
Improved User Interface:
Streamlined Navigation: The Power BI mobile app has undergone a redesign for more intuitive navigation, allowing users to easily find and interact with reports and dashboards.
Customizable Home Screen: Users can now customize their home screen with frequently accessed reports, dashboards, and favorites, providing quick access to critical insights.
Interactive Visualizations:
Touch-Optimized Visuals: Visualizations have been optimized for touch interactions, enabling users to easily drill down, filter, and explore data on their mobile devices.
Enhanced Tooltips: Enhanced tooltips display detailed data points when users tap on visual elements, providing deeper insights without overwhelming the screen.
Offline Access:
Cached Reports: Users can cache reports and dashboards for offline viewing, ensuring access to critical data even without an internet connection.
Automatic Updates: The app automatically syncs and updates cached content when an internet connection is reestablished, keeping data current and accurate.
Notifications and Alerts:
Push Notifications: Users can receive push notifications for data alerts, report updates, and scheduled refreshes, ensuring they stay informed about important changes.
Custom Alerts: Set up custom alerts for specific metrics or KPIs, with notifications sent directly to the mobile device.
Collaboration and Sharing:
In-App Comments: Users can add and respond to comments directly within the mobile app, facilitating real-time collaboration and discussion around data insights.
Easy Sharing: Simplified sharing options to send reports and dashboards via email, messaging apps, or direct links from within the mobile app.
Security Enhancements:
Biometric Authentication: Support for biometric authentication, such as fingerprint and facial recognition, adds an extra layer of security for accessing the app.
Data Encryption: Enhanced encryption protocols to protect data on the device and during transmission, ensuring compliance with security standards.
Remote Data Access and Analysis
Tools and Techniques for Remote Work and Data Access
Cloud-Based Solutions:
Power BI Service: Utilize the Power BI service to access and analyze data from anywhere with an internet connection, providing the full functionality of Power BI’s analytics capabilities remotely.
Azure Integration: Leverage Azure services, such as Azure Synapse and Azure Data Lake, to store, manage, and access large datasets remotely.
VPN and Secure Access:
Virtual Private Networks (VPN): Set up VPNs to securely access on-premises data sources and corporate networks from remote locations.
Secure Gateways: Use Power BI’s On-Premises Data Gateway to enable secure data connectivity between cloud services and on-premises data sources.
Remote Collaboration Tools:
Microsoft Teams Integration: Embed Power BI reports and dashboards in Microsoft Teams channels for seamless collaboration and discussion among remote team members.
Real-Time Co-Authoring: Enable real-time co-authoring of reports and dashboards, allowing multiple users to work together on data analysis and report creation simultaneously.
Data Refresh and Sync:
Scheduled Data Refresh: Set up scheduled data refreshes to ensure that reports and dashboards display the most up-to-date information, even when accessed remotely.
DirectQuery and Live Connection: Use DirectQuery and live connection modes to access real-time data directly from the source, providing current insights without needing frequent data refreshes.
Remote Data Visualization:
Responsive Design: Create reports and dashboards with responsive design elements that adapt to different screen sizes and devices, ensuring a consistent experience across desktops, tablets, and smartphones.
Interactive Features: Include interactive features, such as slicers, filters, and drill-throughs, to enable remote users to explore data and customize views based on their needs.
Security and Compliance:
Conditional Access Policies: Implement conditional access policies to restrict data access based on user location, device, and other criteria, ensuring that remote access complies with security policies.
Data Loss Prevention (DLP): Utilize DLP policies to monitor and prevent unauthorized data sharing and leakage during remote access and collaboration.
Performance Optimization:
Data Compression and Caching: Optimize performance for remote users by implementing data compression and caching techniques, reducing latency and improving response times.
Scalable Infrastructure: Ensure that the underlying infrastructure, including cloud services and data gateways, is scalable to handle increased demand from remote users.
Training and Support:
User Training: Provide training and resources to help users effectively utilize Power BI’s remote access and mobile features, enhancing their ability to work with data from any location.
Help and Support Channels: Maintain robust help and support channels, such as online forums, tutorials, and dedicated support teams, to assist remote users with any issues they encounter.
By enhancing mobile features and providing robust tools for remote data access and analysis, Power BI ensures that users can stay connected to their data and collaborate effectively, regardless of their location. These capabilities are essential for modern, distributed work environments, enabling organizations to maintain productivity and make data-driven decisions from anywhere.
Sustainability and Green Initiatives
Sustainability and green initiatives have gained significant traction in recent years, with organizations across the globe recognizing the importance of environmental conservation. From renewable energy sources to eco-friendly practices, businesses are actively seeking ways to reduce their carbon footprint and promote sustainability.
By adopting green initiatives, companies not only benefit the environment but also ensure a positive impact on their bottom line. The increasing demand for sustainable products and services further underscores the shift towards a greener future, making it imperative for businesses to prioritize sustainability in their operations.
Eco-Friendly Data Practices
How Power BI Supports Sustainability Efforts
Energy-Efficient Data Centers:
Microsoft’s Commitment: Power BI is hosted on Microsoft’s Azure cloud platform, which operates some of the most energy-efficient data centers globally. Microsoft has committed to using 100% renewable energy in its data centers by 2025.
Sustainable Infrastructure: Azure’s infrastructure is designed for high energy efficiency, utilizing advanced cooling techniques and efficient hardware to reduce power consumption.
Optimized Data Processing:
Data Compression: Power BI employs data compression techniques that reduce the amount of storage space required, leading to lower energy use.
Efficient Query Processing: The platform optimizes query processing to minimize computational resources, thus reducing the carbon footprint associated with data analytics.
Cloud-Based Solutions:
Scalable and Flexible: Cloud-based data processing allows for better resource allocation, ensuring that only the necessary computing power is used, which helps in reducing wastage.
Serverless Architecture: Power BI’s serverless architecture means that resources are automatically managed, scaling up or down based on demand, leading to more efficient energy use.
Virtual Collaboration:
Reduced Travel: By enabling virtual collaboration through integrated tools like Microsoft Teams, Power BI reduces the need for physical meetings and travel, contributing to lower carbon emissions.
Remote Access: Power BI’s capabilities for remote data access and analysis support telecommuting, reducing the environmental impact associated with commuting.
Tracking and Reporting on Sustainability Metrics
Tools for Environmental Impact Analysis
Sustainability Dashboards:
Pre-Built Templates: Power BI offers pre-built templates specifically designed for tracking sustainability metrics, such as carbon emissions, energy consumption, and waste management.
Customizable Dashboards: Users can create custom dashboards to track specific sustainability goals and metrics relevant to their organization.
Integration with Environmental Data Sources:
Data Connectors: Power BI supports integration with various environmental data sources, such as IoT sensors, weather data providers, and sustainability reporting frameworks.
Real-Time Data Feeds: Enable real-time data feeds from environmental monitoring systems to keep sustainability metrics current and actionable.
Advanced Analytics for Sustainability:
Predictive Analytics: Use machine learning models to forecast environmental impacts and resource usage, helping organizations plan and implement more sustainable practices.
Scenario Analysis: Conduct scenario analysis to understand the potential environmental impact of different business strategies and operational changes.
Reporting and Compliance:
Automated Reporting: Automate the generation of sustainability reports, ensuring timely and accurate reporting for regulatory compliance and stakeholder communication.
Standards Alignment: Power BI can align reporting with established sustainability frameworks, such as GRI (Global Reporting Initiative) and CDP (Carbon Disclosure Project), facilitating transparent and standardized reporting.
Visualization of Sustainability Data:
Interactive Maps and Charts: Visualize geographical data related to environmental impact using interactive maps, heatmaps, and spatial analysis tools.
Trend Analysis: Utilize trend analysis tools to identify patterns and changes in sustainability metrics over time, aiding in long-term planning and strategy development.
Conclusion
Key trends in Power BI include enhanced AI integration for deeper insights, real-time data processing for timely decision-making, and advanced data connectivity with Azure. User experience improvements ensure accessibility, while augmented analytics enhance data interpretation. Data governance and security measures are prioritized, alongside collaboration tools integrated with Microsoft Teams. Custom visualizations and mobile accessibility support flexible work environments, and sustainability initiatives emphasize environmental responsibility. Businesses can leverage these trends by adopting AI, utilizing real-time data, and expanding data connectivity. Focusing on user experience, governance, and collaboration will drive innovation and success in a data-driven landscape.
Get a Free Consultation from Infiniticube
Ready to elevate your business with Power BI? Schedule your free consultation today and discover how our expertise can drive your success. Don't miss this opportunity to transform your data analytics and stay ahead of the competition. Contact us now to get started!
He is working with infiniticube as a Digital Marketing Specialist. He has over 3 years of experience in Digital Marketing. He worked on multiple challenging assignments.
Our newsletter is finely tuned to your interests, offering insights into AI-powered solutions, blockchain advancements, and more. Subscribe now to stay informed and at the forefront of industry developments.


 June 27, 2025
 Balbir Kumar Singh
 0
0


Leave a Reply